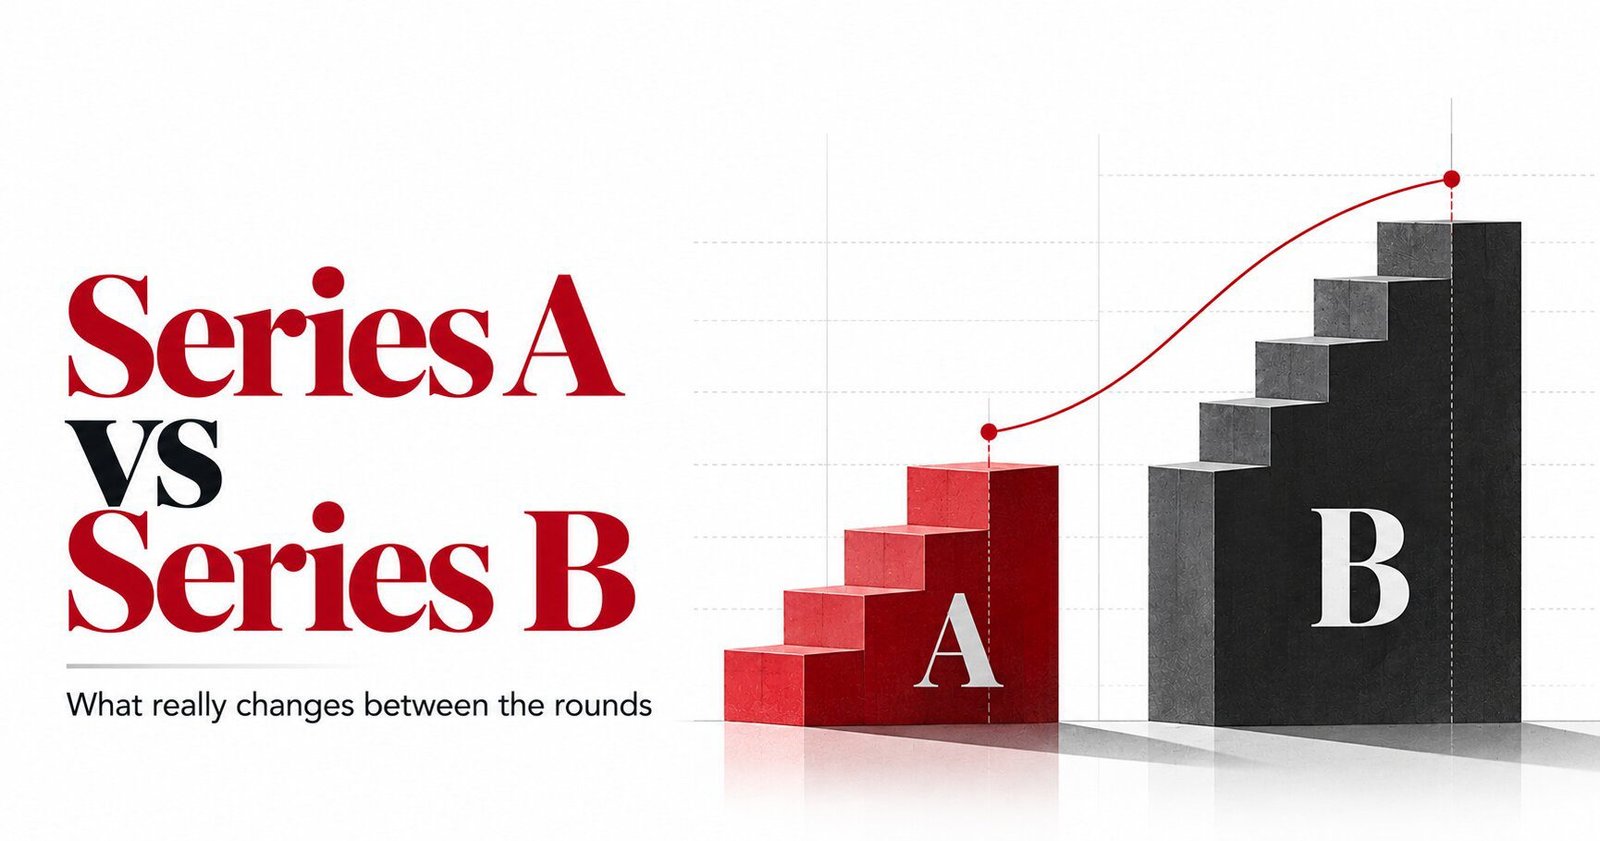
Series A vs Series B is the funding comparison every founder needs before planning a second institutional round, because the cheque, the valuation and the slice you sell all change at once. This guide uses Carta’s July 2026 data to show what Series A vs Series B really costs and what investors expect at each stage.
Key Takeaways
Series A vs Series B: Carta’s July 2026 data puts the median software Series A at $14.4M and the median Series B at $25M.
Median valuation jumps from $80M at Series A to $191M at Series B, about 2.4 times, while the round itself grows about 1.7 times.
Median dilution falls from 18% at Series A to 12% at Series B, so founders sell a smaller slice later.
Only about 15% of seed-stage startups reach Series B in today’s market, per Carta’s August 2025 analysis.
Series B investors want scale and efficiency: SaaStr reports a $4M to $8M ARR bar with 2x to 3x growth.
Startup FundingOctober 27, 20269 min readThe Business Perspective Editorial Team
Series A vs Series B: 5 Costly Differences Founders Miss
Series A vs Series B is not a story about bigger cheques alone. Carta’s July 2026 data on more than 1,000 software rounds shows a median Series A of $14.4M and a median Series B of $25M, yet the valuation climbs far faster than the round size. The Business Perspective reads those numbers beside older Carta and SaaStr benchmarks to show where founders lose ground.
Five differences matter most: round size, valuation, dilution, the proof investors demand and the odds of reaching the next round. Each one changes how you plan runway, hiring and the cap table. Miss one and you can close a good round, then stall before the next.
Every figure below carries its source and date. Where sources disagree or leave a gap, the article says so.
$14.4M vs $25MMedian Series A vs Series B round, Carta, July 2026
$80M vs $191MMedian valuation at each stage, Carta, July 2026
18% vs 12%Median dilution at each stage, Carta, July 2026
~15%Seed startups reaching Series B today, Carta, August 2025
What is the difference between Series A vs Series B funding?
Quick answer: A Series A funds a company that has found a repeatable way to sell and now needs the team and process to scale it. A Series B funds a company that has proven that engine and wants to expand it. Series A vs Series B is a shift from proving to scaling.
Seed money pays for discovery. A Series A pays for the first repeatable sales motion and a team around it.
A Series B pays for scale: new markets, new products and a management layer that can run them. The table below frames the shift. It is editorial framing, not a statistic.
Stage
Main question investors ask
What the money usually buys
Seed
Does anyone want this product?
Product build and first customers
Series A
Can this be sold again and again?
First sales team, product depth, core hires
Series B
Can this scale across markets and segments?
Expansion, new products, a larger team
Source: The Business Perspective editorial framing.
The five costly differences, in the order this article covers them:
Round size: the cheque grows about 1.7 times.
Valuation: the price tag grows about 2.4 times.
Dilution: the slice sold drops from 18% to 12%.
Proof: investors move from “can it sell?” to “can it scale efficiently?”
Odds: most seed-stage companies never reach a Series B.
How different are round size and valuation in Series A vs Series B?
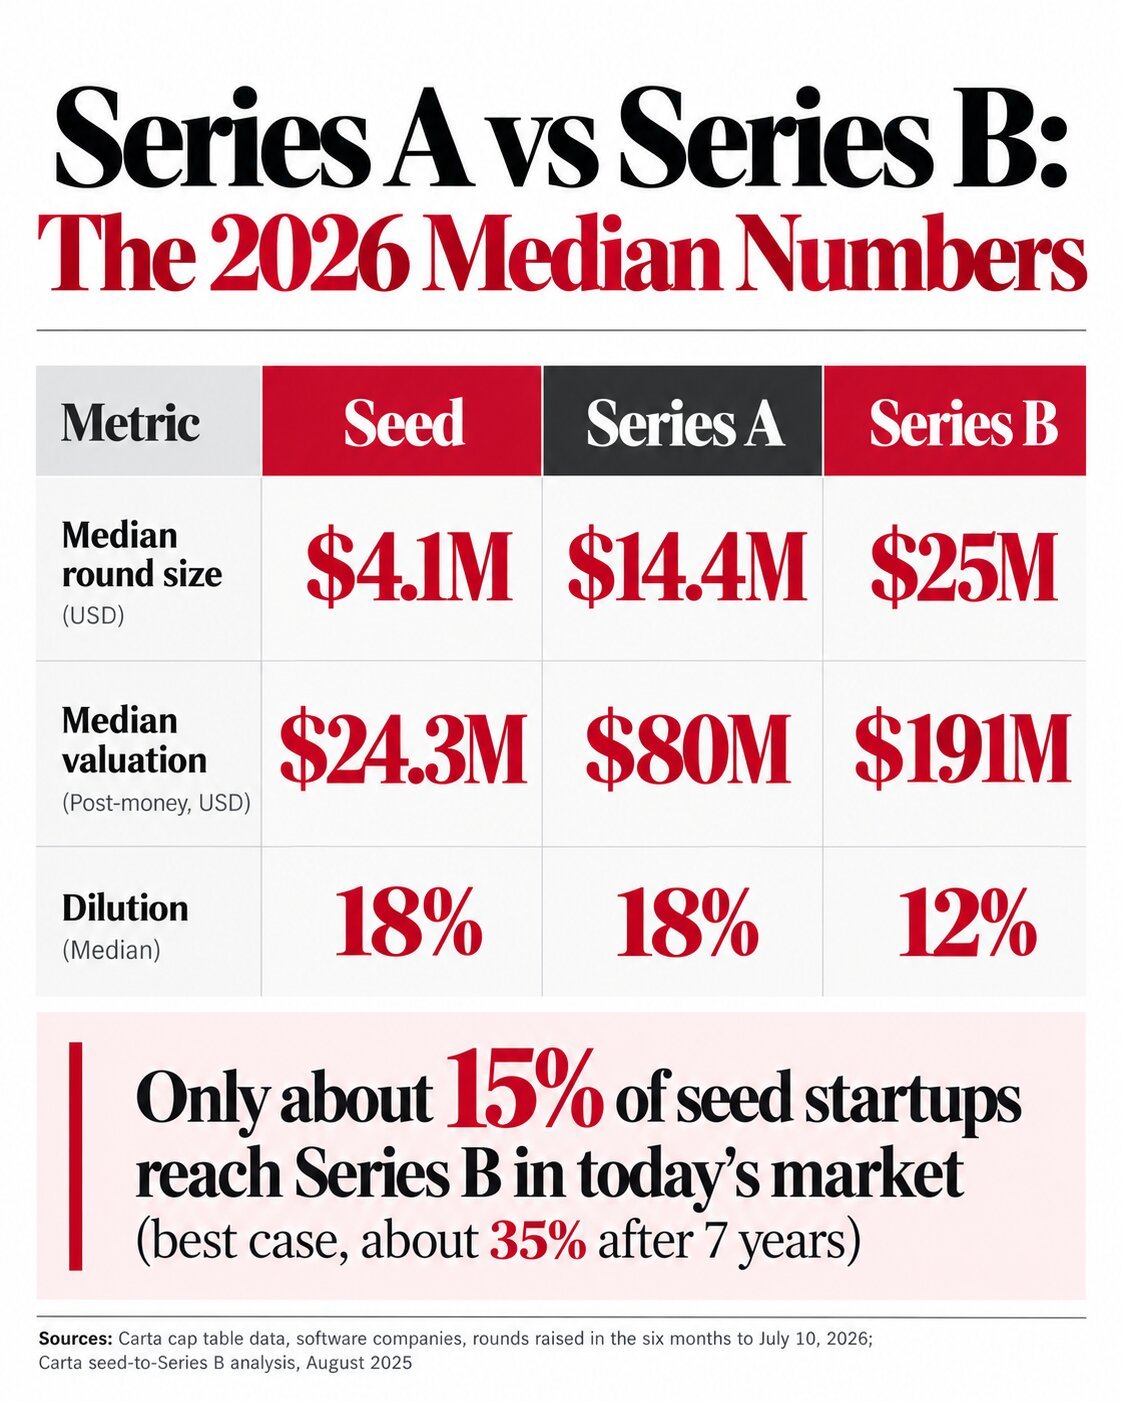
Quick answer: Carta’s July 2026 data puts the median software Series A at $14.4M raised at an $80M valuation, and the median Series B at $25M at $191M. The round grows about 1.7 times, but the valuation grows about 2.4 times. Founders sell a smaller slice of a much larger company at Series B.
Stage
Median round
Median valuation
Median dilution
Seed
$4.1M
$24.3M
18%
Series A
$14.4M
$80M
18%
Series B
$25M
$191M
12%
Source: Carta, “VC Startup Fundraising Benchmarks From 1000 Rounds,” Peter Walker, July 10, 2026.
Read the method before you quote these numbers. Carta looked at software companies on its cap table platform that raised in the prior six months, and it excluded bridges and extensions. Series A and Series B are separate samples, not the same companies followed over time. Carta’s post does not say whether the valuations are pre-money or post-money, so compare them within the table only.
The step-ups tell the story. Valuation rises about 3.3 times from seed to Series A, then about 2.4 times from Series A to Series B. The climb slows, yet it still outpaces the round size. Founders who need a refresher on how those prices are built can read how to calculate startup valuation.
Median round size, valuation and dilution by stage. Source: Carta, July 2026.
Treat any single benchmark as a range. Three Q3 2026 trackers covered in our look at global venture funding Q3 2026 differ by $28.2B on one quarter’s total, so medians from one dataset are a guide, not a rule.
How much dilution do founders take in Series A vs Series B?
Quick answer: Carta’s July 2026 medians show 18% dilution at both seed and Series A, and 12% at Series B. Series B takes a smaller slice than Series A. Stacked together, pre-seed holders would own about 59% after all three rounds, before option pool top-ups and bridges.
Carta’s medians stack into a simple illustration. Start with everyone who held shares before the seed round at 100%. Apply 18% dilution at seed, 18% at Series A and 12% at Series B, and the pre-seed holders end near 59%.
After this round
Median dilution applied
Pre-seed holders still own
Seed
18%
82.0%
Series A
18%
67.2%
Series B
12%
59.2%
Illustration by The Business Perspective using Carta’s July 2026 medians. The three medians come from separate samples, so no real company will match exactly.
Real cap tables run lower. Option pool top-ups, bridge rounds and convertible instruments all add dilution that a clean median does not show. The instrument you choose before the priced round matters, which is why SAFE note vs convertible note is worth reading early.
Percentages are only half of the cost. Terms decide who gets paid first in a weak exit. Our startup term sheet guide cites Cooley’s Q1 2026 data showing that 98.2% of deals carried a 1x liquidation preference, so the clause is close to standard and the fight is over what surrounds it.
What proof do investors want in Series A vs Series B?
Quick answer: Series A investors look for early repeatable revenue and fast growth. Series B investors want scale and efficiency. SaaStr puts the Series B bar at $4M to $8M ARR, up from $2M to $4M before 2021, with 2x to 3x annual growth, net revenue retention above 110% and CAC payback under 18 months.
Signal
Series A
Series B
Annual recurring revenue
Most rounds at $1M to $5M (Point Nine, 2023)
$4M to $8M, up from $2M to $4M before 2021 (SaaStr, May 2025)
Growth
More than half of rounds growing over 2x a year (Point Nine, 2023)
2x to 3x a year (SaaStr, May 2025)
Sources: Point Nine figures as summarised by Waveup; SaaStr, May 17, 2025. The two sources measure different things, so compare direction, not decimals.
Point Nine describes companies that actually raised. SaaStr describes what investors now want. SaaStr also cites Carta data on 10,755 US Series A startups for its cohort figures, but it does not attribute the ARR and growth thresholds to Carta. Treat them as an informed view, not audited data.
SaaStr adds two Series B tests that rarely appear at Series A:
Net revenue retention: above 110%.
CAC payback: under 18 months.
Medians also hide a split by sector. PitchBook-NVCA data for Q1 2026, cited by Waveup, shows AI companies raising Series A at a $78.0M pre-money valuation against $42.4M for non-AI companies. AI founders can read the Series B side in AI startup Series B funding 2026.
What are the odds of reaching Series B after a Series A?
Quick answer: Carta’s August 2025 analysis puts the realistic share of seed startups reaching Series B near 15% today, against about 35% after seven years in the best market. A separate Carta analysis found only 10% of US SaaS companies that raised a Series A in early 2022 reached Series B within two years.
Measure
Figure
Source and date
Seed startups reaching Series B, realistic today
About 15%
Carta, August 2025
Seed startups reaching Series B after seven years, best market
About 35%
Carta, August 2025
Seed startups reaching Series B, normal market
About 17% to 20%
Carta, August 2025
US SaaS Series A (H1 2022) reaching Series B within two years
10%
Carta, June 2024
Series A cohorts of 2018 to 2020 reaching Series B by year four
40% to 50%+
SaaStr, May 2025
Typical gap between rounds
About 24 months
SaaStr, May 2025
Sources: Carta (Peter Walker), August 7, 2025 and June 19, 2024; SaaStr, May 17, 2025.
The older cohorts look better because they had more time. SaaStr also reports that fewer than 10% of companies raise a follow-on within six months of a Series A, and that 25% to 35% of successful Series B companies raised intermediate funding first. Carta’s August 2025 post adds that roughly 5% to 6% of a seed cohort is acquired before reaching a Series B.
The Business Perspective found no 2026 Series A to Series B graduation rate in Carta’s public posts, so this article does not state one. Planning for about two years between rounds is the safest reading of the data above.
What do critics say about Series A vs Series B benchmarks?
The counterpoint worth taking seriously
Critics argue that medians mislead more than they guide. Carta’s Series A and Series B figures come from separate samples of software companies, so the $14.4M to $25M move describes two groups, not one company’s path. A founder in a hardware, health or industrial niche may sit far from either median.
A second objection is timing and survivorship. Companies that raised in the last six months are the ones that could raise. The many that tried and failed do not appear in a round-size median, so the numbers can look friendlier than the market felt to the average founder.
A third objection is that ARR bars come from commentary, not audited datasets. SaaStr’s Series B thresholds are a practitioner view. The Business Perspective treats them as direction, and treats Carta’s medians as the harder evidence.
Sources and method: all figures come from Carta posts dated July 10, 2026, August 7, 2025 and June 19, 2024, SaaStr’s May 17, 2025 article, and secondary summaries by Waveup, each named where used. Verify them against the originals before you rely on them. This article is not investment advice.
How should founders prepare for Series A vs Series B?
Quick answer: Plan the next round before closing the current one. Model dilution with the table above, track retention and CAC payback monthly, and size the raise for about 24 months, the typical gap SaaStr reports between rounds. In Series A vs Series B, the second round rewards efficiency more than the first.
Model dilution before you sign. Use the stacked table above, then add your option pool and any bridge.
Track retention and CAC payback monthly. Series B diligence asks for both, and a clean history is hard to rebuild later.
Plan for 24 months, not 12. Raise enough to reach the next round’s bar with a buffer.
Hold board discipline early. A clear startup board meeting agenda makes the later diligence story easier to tell.
The Business Perspective also covers adjacent sectors. Founders building connected-device products can follow the same funding cycle through our sister publications IoT Insights Hub and IoT Mail Bridge.
Frequently Asked Questions
What is the main difference between Series A and Series B?
A Series A funds a company that has found a repeatable way to sell and needs a team to scale it. A Series B funds a company that has proven that engine and wants to expand into new markets or products. Investors shift from asking whether it can sell to asking whether it can scale efficiently.
How big is a typical Series A vs Series B round in 2026?
Carta's July 2026 data on more than 1,000 software rounds shows a median Series A of $14.4M at an $80M valuation and a median Series B of $25M at a $191M valuation. The samples are separate, and Carta does not say whether valuations are pre-money or post-money.
How much dilution do founders take at Series A and Series B?
Carta's July 2026 medians show 18% dilution at Series A and 12% at Series B. Seed was also 18%. Stacking the three medians leaves pre-seed holders near 59%, before option pool top-ups, bridge rounds and convertibles, which push real dilution higher for most companies.
How much ARR do you need for a Series B?
SaaStr's May 2025 article puts the Series B bar at $4M to $8M ARR, up from $2M to $4M before 2021, with 2x to 3x growth, net revenue retention above 110% and CAC payback under 18 months. SaaStr does not attribute those thresholds to Carta, so treat them as a practitioner view.
What percentage of startups reach Series B?
Carta's August 2025 analysis puts the realistic share of seed startups reaching Series B near 15% today. In the best market, about 35% reach it after seven years. In a normal market the figure is about 17% to 20%. Roughly 5% to 6% are acquired before a Series B.
How long does it take to go from Series A to Series B?
SaaStr's May 2025 article reports a median of about 24 months between rounds. Carta's June 2024 analysis found only 10% of US SaaS companies that raised a Series A in early 2022 reached Series B within two years. Plan for at least two years of runway.
What Series A vs Series B means for your next raise
Series A vs Series B comes down to proof and price. The cheque grows about 1.7 times, the valuation about 2.4 times, and the slice you sell shrinks from 18% to 12%. In return, investors expect scale, retention and efficiency, and fewer companies get there than most founders assume.
The Business Perspective will update these benchmarks when Carta publishes its next round data. Until then, plan around the medians in the table, keep a two-year runway in view and verify every number against its source before it goes into your deck. That discipline is what separates a clean Series A vs Series B transition from a stalled one.
Published by The Business Perspective, written by the Editorial Team. Data cited inline from Carta, SaaStr, Point Nine, PitchBook-NVCA and Waveup. Editorial analysis, not investment advice.
Carta data
equity dilution
seed to Series B
Series A Funding
Series A vs Series B
Series A vs Series B is the funding comparison every founder needs before planning a second institutional round, because the cheque, the valuation and the slice you sell all change at once. This guide uses Carta’s July 2026 data to show what Series A vs Series B really costs and what investors expect at each...
Key Takeaways Global venture funding Q3 2026 runs from $159B (Crunchbase) to $170.9B (KPMG) to $187.2B (CB Insights), a $28.2B spread for a single quarter. AI took the biggest share. Crunchbase puts it at 64% ($102B) of Q3 funding, and CB Insights says AI holds 71% of 2026 funding so far. Deal counts do not...
EXCLUSIVE • AI FUNDING RACE Key Takeaways $1.25T after a $150B cut: OpenAI funding round valuation 2026 dropped from $1.4T in January to $1.25T in June, per deal terms shared with The Business Perspective. $30B Series J closed June 2026: Led by SoftBank, Microsoft, Thrive Capital and New Enterprise Associates, per company disclosures. Anthropic’s $2T...