Why startups fail is rarely explained by the famous 90% claim, and the real causes are easier to spot than most founders think. This guide from The Business Perspective shows why startups fail using official survival data and post-mortem studies.
Key Takeaways
The 90% figure is narrower than it sounds. One review says its origin is unclear, and it holds mainly for venture-backed startups over about ten years, per Nanoglobals.
Official data is gentler. The U.S. Bureau of Labor Statistics shows 50.2% of new business locations opened in 2015 survived five years, and 34.7% survived ten.
Why startups fail starts with the market. CB Insights found “no market need” was the top reason in 42% of 101 post-mortems, and Failory’s founder interviews put marketing problems at 56%.
Venture-backed failure is a different test. Harvard’s Shikhar Ghosh found about 75% of VC-backed startups never returned cash to investors, per Failory and the Wall Street Journal.
You can check your own risk. The Business Perspective’s free 20-page field guide includes a seven-cause scorecard, runway and unit-economics worksheets and a 30-day plan.
Startups & Funding11 min readBy The Business Perspective Editorial Team
Why Startups Fail: 7 Costly Truths Behind the 90% Claim
Everyone has heard the number. Nine in ten startups fail. It shows up in pitch decks, podcasts and family dinners, and almost nobody can say where it came from. Understanding why startups fail starts with checking that number before you believe it.
The Business Perspective went to the primary data, including U.S. Bureau of Labor Statistics survival tables and post-mortem studies, to see what holds up. The short version is that the 90% claim is narrower than it sounds, and the real causes are more useful than the scary statistic. Every figure below names its source.
We also built a free 20-page companion with worksheets for your own company. You will find the download in the box below.
Free download: The Startup Failure Field Guide
Twenty pages from The Business Perspective with a seven-cause risk scorecard, runway and unit-economics worksheets, a pre-mortem and a 30-day rescue plan.
42%cite no market need as the top reason (CB Insights, 101 post-mortems)
50.2%of 2015 new business locations still open after 5 years (BLS)
34.7%still open after 10 years (BLS)
75%of VC-backed startups never returned cash to investors (Ghosh, via Failory)
Is it true that 90% of startups fail?
Only under a narrow definition. The 90% figure is tied to venture-backed startups over roughly ten years, and one review says its origin is unclear. For all new businesses, official U.S. data shows about half still open after five years. What counts as failure changes the answer.
Here is the awkward part. The closest source is Startup Genome, which one analysis summarises as finding that only about one in twelve entrepreneurs succeed, per Nanoglobals. The same review says the exact origin of the 90% figure is not clear, and that the year of the report is itself inconsistent across citations.
A second number competes with it. Harvard Business School’s Shikhar Ghosh found that about 75% of venture-backed startups never returned cash to investors, per a Wall Street Journal report cited by Failory. His dataset covers roughly 2,000 companies.
Three famous failure claims and what each really measures
Claim
Source
What it measures
9 in 10 startups fail
Startup Genome (origin unclear, per Nanoglobals)
Startups over about ten years, against an investor-style bar for success
75% of VC-backed startups fail
Shikhar Ghosh, Harvard Business School, via WSJ and Failory
Venture-backed companies that never returned cash to investors
About half of businesses close within five years
U.S. Bureau of Labor Statistics
All new private-sector business locations, not just startups
Notice that the three do not measure the same thing. One judges startups against a venture bar, one counts cash returned and one simply counts who is still open. That is why a single headline number misleads. Our report on why startups fail and how businesses fail worldwide covers the wider picture.
What does official data say about how many businesses survive?
About half of new business locations are still open after five years, and roughly a third after ten. U.S. Bureau of Labor Statistics data for the 2015 opening cohort shows 79.6% survived one year, 69.1% two years, 50.2% five years and 34.7% ten years. The curve has hardly changed across cohorts.
Share of new private-sector business locations still open (BLS, by opening cohort)
Opening cohort
1 year
2 years
5 years
10 years
2005
80.1%
68.7%
46.8%
33.8%
2010
78.6%
68.6%
51.1%
35.3%
2015
79.6%
69.1%
50.2%
34.7%
2020
80.9%
72.3%
51.4%
not yet available
These figures come from the BLS Business Employment Dynamics survival table, where cohorts are years ended March. Do the arithmetic on the 2015 row and about two-thirds of locations were closed within ten years, our calculation (100% minus 34.7%). The pattern is steady across a decade of cohorts.
The 2022 cohort is worth a glance. Its one-year survival rate, 76.3%, was the lowest since the 2008 cohort at 75.2%, per BLS. That is a small dip, not a collapse, but it shows the data moves with the economy.
One warning before you quote any of this. BLS counts establishments, meaning individual business locations. A closed shop is not always a failed company, and a barber shop is not a venture-backed startup. Treat the table as a base rate for new businesses, not for tech startups.
What counts as failure for a startup?
It depends on who is counting. Governments usually count closures. Venture investors count whether they got their money back, or whether the company hit a large multiple such as 10X. Many measures treat anything short of closure as survival, including zombie companies and small acquisitions, per Nanoglobals.
Five definitions of startup failure
Definition
What it means
Who uses it
Closed
The business stopped operating or became insolvent
Government data such as BLS
Never returned cash
Investors did not get their money back
Venture studies such as Ghosh’s
Missed the venture bar
No large multiple, such as 10X
Venture investors
Zombie
Still alive, not growing, unable to raise
Founders and advisers
Soft landing
Acquired in a small deal, often for the team
Mixed; often counted as survival
Nanoglobals argues that the 90% number is roughly accurate only when you use the harshest definition, a venture-backed startup measured over ten years against a high-multiple bar. Loosen the definition and the figure falls fast. A founder building a profitable business that never raises venture money can be a success on every measure that matters to them.
So before you worry about the number, define your own. Our field guide has a short exercise for exactly this, and it takes five minutes. For founders weighing investors, our startup term sheet guide explains the terms that shape what an investor counts as a win.
What are the real reasons why startups fail?
Two public datasets agree that the market comes first. CB Insights found “no market need” was the top reason in 42% of 101 post-mortems in 2018. Failory’s interviews with founders of more than 80 failed startups put marketing problems, mostly missing product-market fit, at 56%. Money and people follow.
Why founders say their startups failed
Source
Finding
Sample and caveat
CB Insights (2018)
No market need was the top reason in 42% of cases
101 post-mortems; percentages for other reasons not available to us
80+ failed startups; self-selected, and Failory interprets the answers
Both samples are small, and both rely on founders explaining their own failures. That is useful, but it is not a census. Failed companies that never wrote a post-mortem are missing, which is our caveat rather than the authors’.
Even so, on why startups fail, the direction is hard to miss. Building something people will not pay for outranks bad code, bad law and bad operations. Our startup funding coverage, such as how to raise seed funding for startups, keeps returning to the same point: investors fund evidence of demand, not enthusiasm.
What are the 7 costly truths behind why startups fail?
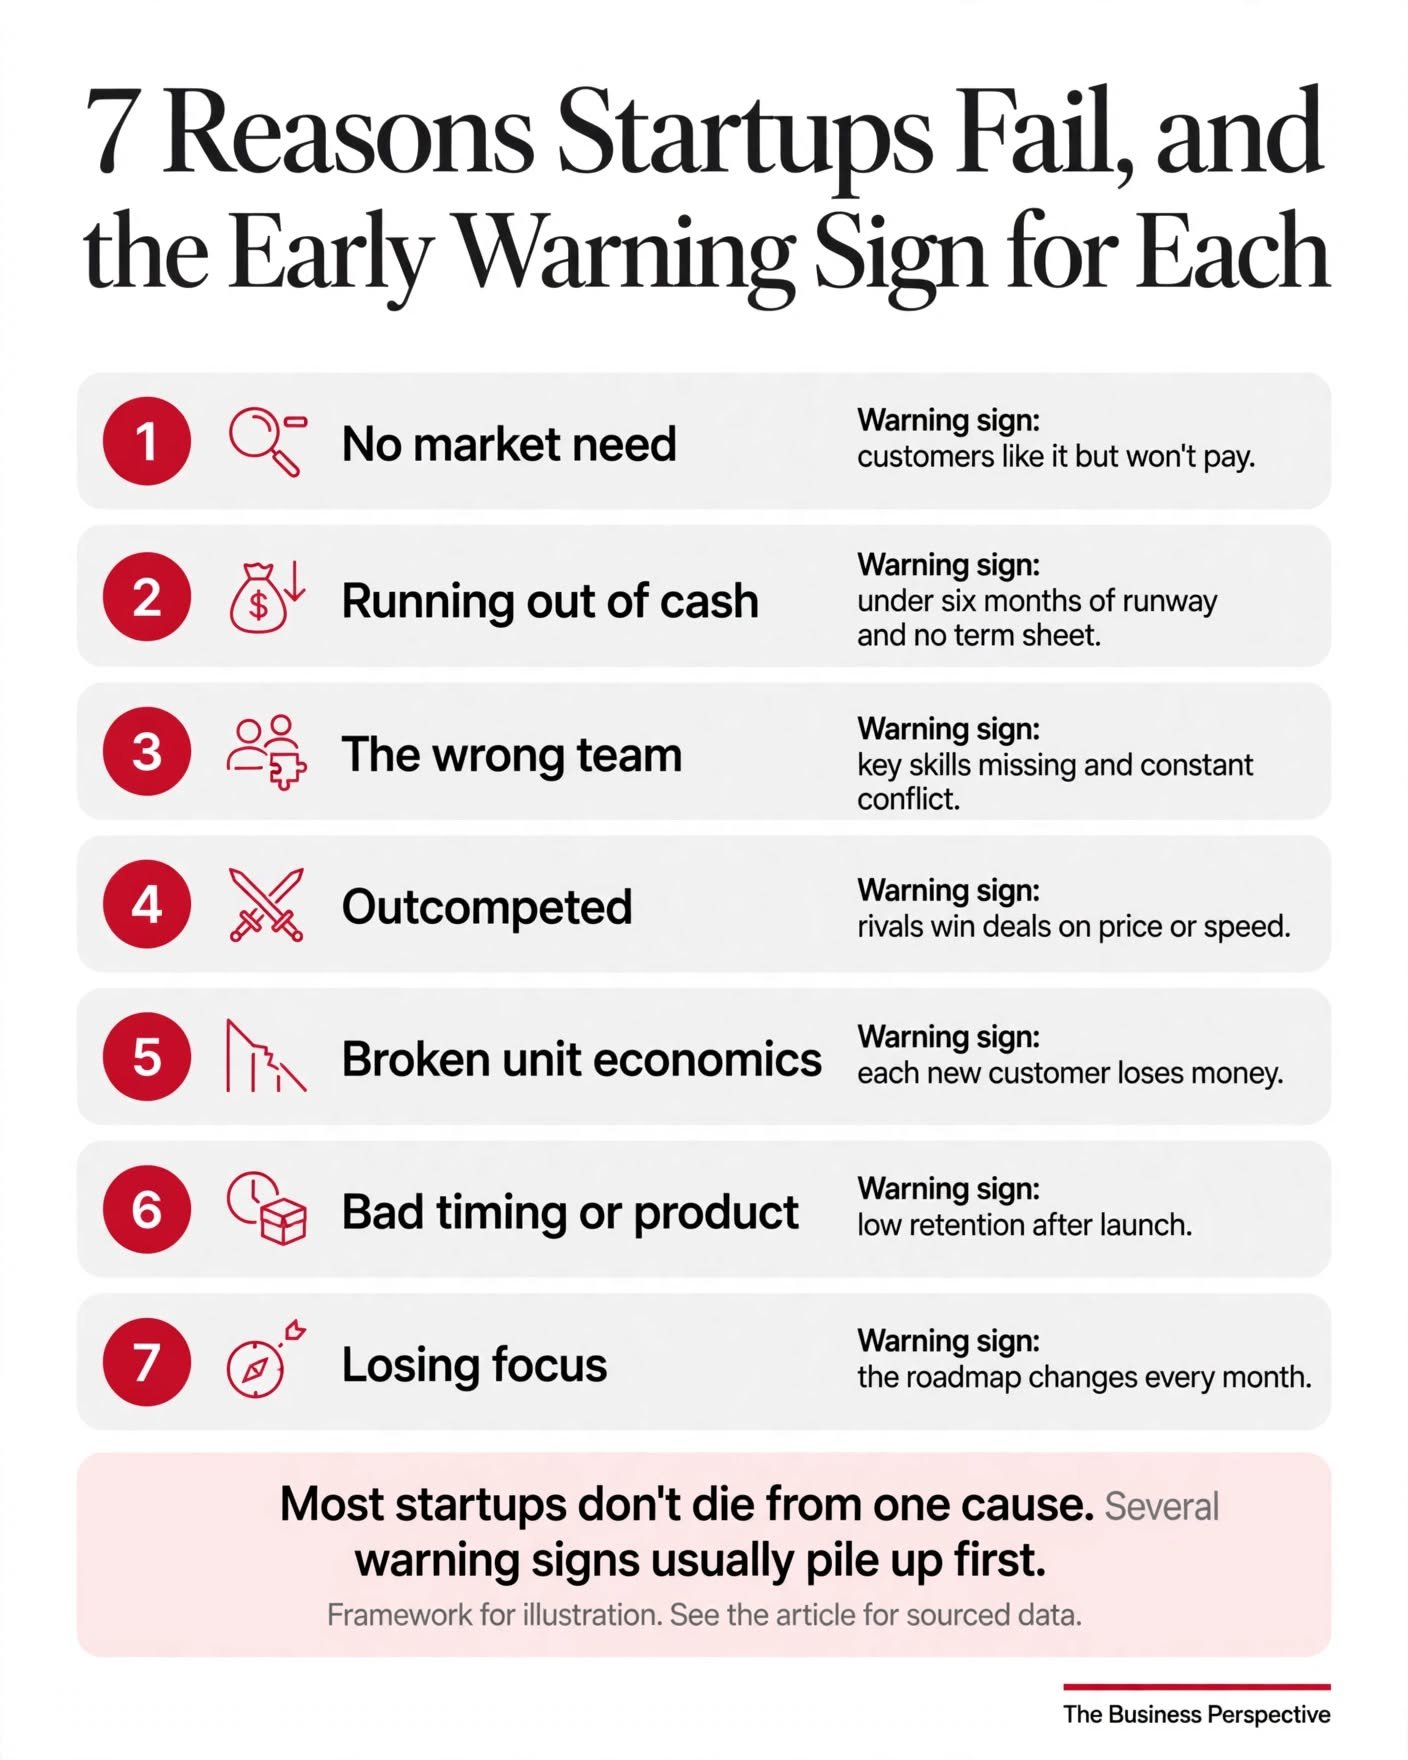
Seven causes keep appearing: no market need, running out of cash, the wrong team, being outcompeted, broken unit economics, weak retention and lost focus. This grouping is The Business Perspective’s own, built from CB Insights and Failory data. Most startups face several at once, and one cause usually triggers the next.
Seven causes and the early warning sign for each. The grouping is The Business Perspective’s own framework.
1. The market, not the code, kills most startups
This is the big one. CB Insights found it was the top reason in 42% of 101 post-mortems, and Failory’s interviews put marketing, mostly missing product-market fit, at 56%. The warning sign is simple: people say “nice idea” but never pay.
The fastest test is to ask for money, or a signed letter of intent, before you build the next feature. Praise is cheap. A purchase order is a signal.
2. Cash ends the story, whatever started it
Finance was the cause in 16% of Failory’s founder interviews. Running out of money is often the last blow even when something else started the decline. The formula is plain: runway equals cash in the bank divided by net monthly burn.
Our rule of thumb, not a benchmark, is that fundraising takes longer than founders expect. Know your runway in months and start early. If you are weighing a first round, see our guide to pre-seed versus seed rounds.
3. Teams break before products do
Team problems were behind 18% of cases in Failory’s interviews. They rarely look like bad people. They look like missing skills, unclear roles and decisions nobody owns.
A quick check helps. Ask each founder, separately, to write down who owns product, revenue, hiring and money. If the answers differ, you have found the problem, and a written agreement on equity and vesting is the next step. For what employees will ask you, see how candidates negotiate startup equity.
4. Rivals only need to be easier to buy
Being outcompeted appears among CB Insights’ leading failure reasons, though its percentage was not available to us. The danger is not always a bigger rival. It is a rival that is faster, cheaper or simply easier to buy.
Run a win/loss log for 30 days and record the real reason from each lost customer, not the one in your CRM notes. That single habit turns vague worry about competitors into specific fixes.
5. Growth can make bad unit economics worse
Pricing and costing issues also feature in CB Insights’ list. The pattern is simple. Each new customer costs more to win and serve than they ever pay, so growth makes the hole deeper.
Three numbers tell you where you stand: customer acquisition cost, payback in months and customer lifetime. Our field guide includes a worksheet with a worked example, and the arithmetic is shown so you can check it yourself.
6. Weak retention exposes timing and product problems
Technology problems were the cause in 6% of Failory’s interviews, but the deeper issue is whether users stay. If each new signup cohort drops to near zero, growth is hiding a leak and better acquisition will not fix it.
Plot retention by signup month. It is the quickest way to find out whether the product, or the timing, is the problem.
7. Losing focus is the quiet killer
This cause is our own addition. It is not a measured category in the datasets above, so read it as editorial judgment. A company that chases every request ends up serving no customer well, and the roadmap changes monthly while nothing gets finished.
Ask five team members for the top priority this quarter. Five answers means the problem is focus, not effort. Strong boards force this clarity, which is why our startup board meeting agenda puts one metric first.
How can founders spot failure early?
Score each of the seven causes from 0 to 3 honestly, then add the total. Know your runway in months, your payback period per customer and whether paying customers stay. Our scorecard is a planning tool, not validated research, but it forces you to see all seven risks together on one page.
Seven causes: warning sign and first fix
Cause
Early warning sign
First fix
No market need
Praise but no payment
Ten customer conversations and one paid pilot
Out of cash
Runway unknown or under about nine months
Calculate burn, cut three costs, start the raise early
Wrong team
Two people both think they lead
Write who owns what, with decision rights
Outcompeted
Lost deals with no clear reason
30-day win/loss log
Broken unit economics
Payback longer than customers stay
Fix price, cost or churn before buying growth
Weak retention
New cohorts drop off quickly
Plot retention by signup month
Lost focus
Five people, five priorities
One metric, one customer, one goal
The Business Perspective’s free field guide turns this table into a fillable scorecard for diagnosing why startups fail, with a runway calculator, a unit-economics worksheet, a pre-mortem template and a 30-day rescue plan. It is twenty pages and works for solo founders and teams alike.
Free download: The Startup Failure Field Guide
Twenty pages from The Business Perspective with a seven-cause risk scorecard, runway and unit-economics worksheets, a pre-mortem and a 30-day rescue plan.
Critics make three points. The 90% figure may be fair for venture-backed startups judged on a high bar, and government data counts locations, not startups. Post-mortem studies are also small and self-selected. We agree with all three, which is why every number here carries its source and its limits.
Here is what sceptics say, and they have a point.
The 90% figure can be defended. Nanoglobals calls it roughly accurate when applied to venture-backed startups over ten years against a 10X bar. Venture investors do judge companies this way.
BLS is not a startup dataset. It counts business locations across the private sector, so it can understate how hard tech startups find survival.
Post-mortems are thin. Failory notes its sample is self-selected and that it interprets the founders’ answers, and the CB Insights study covers 101 cases.
Survival is not success. Staying open can mean a zombie company that never grows or returns capital.
Our view at The Business Perspective is that none of this makes the headline number useful. It makes the definition useful. Decide what failure means for your company, then measure against that. Our AI bubble analysis shows how fast investor definitions of success can shift when capital tightens.
What do readers ask about startup failure?
Readers most often ask whether the 90% figure is true, what the top cause is, how many businesses survive five years, what share of venture-backed startups fail, how long failure takes and how to spot the risk. The Business Perspective’s six answers below are short and sourced.
Is it true that 90% of startups fail?
Only under a narrow definition. The 90% figure is tied to venture-backed startups over about ten years, and one review says its exact origin is unclear. Official U.S. data shows roughly half of all new business locations are still open after five years, so the answer depends on what you count as failure.
What is the number one reason startups fail?
Lack of market need tops the lists. CB Insights found it was the leading reason in 42% of 101 startup post-mortems it analysed in 2018. Failory’s founder interviews point the same way, with marketing problems, mostly missing product-market fit, cited in 56% of cases. Both samples are small, so treat them as patterns.
How many new businesses survive five years?
About half. U.S. Bureau of Labor Statistics data shows 50.2% of private-sector establishments opened in the year to March 2015 were still open after five years, and 34.7% after ten. These figures cover all new business locations, not only startups, so tech companies may behave differently.
What percentage of venture-backed startups fail?
A widely cited figure is 75%. Harvard Business School’s Shikhar Ghosh, as reported by the Wall Street Journal and cited by Failory, found about three in four venture-backed companies never returned cash to investors. That is a narrower definition of failure than closing down, based on roughly 2,000 companies.
How long does it take for a startup to fail?
Closures cluster early but continue for years. BLS data for the 2015 cohort shows about 20% of new establishments were gone within one year, about 31% within two and about 50% within five. Failure can also be slow, with zombie companies surviving for years without growth, so timing varies widely.
How can founders tell if their startup is at risk?
Score the seven causes honestly: market need, cash runway, team, competition, unit economics, retention and focus. Know your runway in months, your payback period per customer and whether paying customers stay. Our free field guide includes a one-page risk scorecard, a runway calculator and a 30-day plan to act on the results.
What should you do now that you know why startups fail?
Stop quoting the 90% number and start checking your own risks. Define what failure means for your company, know your runway and unit economics, talk to paying customers and score the seven causes honestly. That is how you act on why startups fail instead of just worrying about it.
The honest takeaway is that the scary number tells you little, but the causes tell you a lot. Most failures start with a market that does not care, and most are made worse by cash, team and focus problems that were visible months earlier. That is good news, because visible problems can be fixed.
Take the field guide into your next team meeting, fill in the scorecard together and pick one cause to fix this month. The Business Perspective will keep publishing practical, sourced guides like this one for founders and investors. If you are on the other side of the table, our ten biggest AI agent rounds of October 2026 show where capital is flowing now.
Free download: The Startup Failure Field Guide
Twenty pages from The Business Perspective with a seven-cause risk scorecard, runway and unit-economics worksheets, a pre-mortem and a 30-day rescue plan.
Sources: U.S. Bureau of Labor Statistics (Business Employment Dynamics, Table 7), CB Insights (analysis of 101 startup post-mortems, 2018, via StartupNews), Failory (founder interviews and summary of Shikhar Ghosh’s Harvard Business School research reported in the WSJ), Nanoglobals (analysis of the 90% claim). The seven-cause grouping is The Business Perspective’s own framework. This article is education, not legal, tax or financial advice. Published by The Business Perspective Editorial Team to explain why startups fail.
90% of startups fail
founder mistakes
product-market fit
running out of cash
startup failure rate
Alexander Sterling is a business journalist and financial analyst
covering startup funding, venture capital, and AI investment trends.
He tracks the deals, valuations, and founder stories shaping the
global business landscape in 2026.
Why startups fail is rarely explained by the famous 90% claim, and the real causes are easier to spot than most founders think. This guide from The Business Perspective shows why startups fail using official survival data and post-mortem studies. Key Takeaways The 90% figure is narrower than it sounds. One review says its origin...
Key Takeaways A share count alone tells you nothing. Carta’s Peter Walker wrote in January 2026 that an offer of “5,000 shares” means you “don’t know anything.” Before you negotiate startup equity, get the strike price and your ownership percentage. The 90-day window is the standard trap. Per Carta, 80% of terminated option grants in...
Funding & VC • Exclusive Breakdown Key Takeaways Manus AI funding $500M closed Oct 8, 2026 — first round since Meta had to unwind its $2B acquisition in April, per company WeChat post. $4B valuation — doubles the ~$2B price Meta agreed to in Dec 2025, per Bloomberg and LatePost reporting Oct 8. Boyu Capital...